Plot the trend of one datacube of a EBV netCDF over time
(x-axis). Different options can be chosen based on the method argument.
ebv_trend(
  filepath,
  datacubepath = NULL,
  entity = NULL,
  method = "mean",
  subset = NULL,
  color = "dodgerblue4",
  touches = TRUE,
  scenario = NULL,
  metric = NULL,
  verbose = TRUE
)
Arguments
- filepath
Character. Path to the netCDF file.
- datacubepath
Character. Optional. Default: NULL. Path to the datacube (use
ebv_datacubepaths()). Alternatively, you can use the scenario and metric argument to define which cube you want to access.- entity
Character or Integer. Default is NULL. If the structure is 3D, the entity argument is set to NULL. Else, a character string or single integer value must indicate the entity of the 4D structure of the EBV netCDFs.
- method
Character. Default: mean. Choose one of the following options for different plots: mean, min, max, boxplot. See Note for more
- subset
Character. Default: NULL. If you want to look at the trend for a spatial subset, define the path to the shapefile encompassing the area. Ending needs to be *.shp.
- color
Character. Default: dodgerblue4. Change to any color known by R
grDevices::colors()- touches
Logical. Optional. Default: TRUE. Only relevant if the subset is indicated by a shapefile. See
ebv_read_shp().- scenario
Character or integer. Optional. Default: NULL. Define the scenario you want to access. If the EBV netCDF has no scenarios, leave the default value (NULL). You can use an integer value defining the scenario or give the name of the scenario as a character string. To check the available scenarios and their name or number (integer), use
ebv_datacubepaths().- metric
Character or integer. Optional. Define the metric you want to access. You can use an integer value defining the metric or give the name of the scenario as a character string. To check the available metrics and their name or number (integer), use
ebv_datacubepaths().- verbose
Logical. Default: TRUE. Turn off additional prints by setting it to FALSE.
Value
Returns plots and eventually values based on the method argument.
See Note for more information
Note
More information on the method argument: using mean will result in
a plot of the mean over time, additionally a vector of the mean values is
returned. If the data encompasses only one timestep a single mean is
returned. Corresponding behavior can be expected for min and max. The
boxplot option results in boxplots over time (no values are returned).
Examples
#set path to EBV netCDF
file <- system.file(file.path("extdata","martins_comcom_subset.nc"), package="ebvcube")
#get all datacubepaths of EBV netCDF
datacubes <- ebv_datacubepaths(file, verbose=FALSE)
# \donttest{
#plot the change of the mean over time of the first datacube
ebv_trend(filepath = file, datacubepath = datacubes[1,1], entity = 1)
#> [1] "Giving the properties for the file and a specified datacube."
#> [1] "calculating timesteps..."
#> ================================================================================
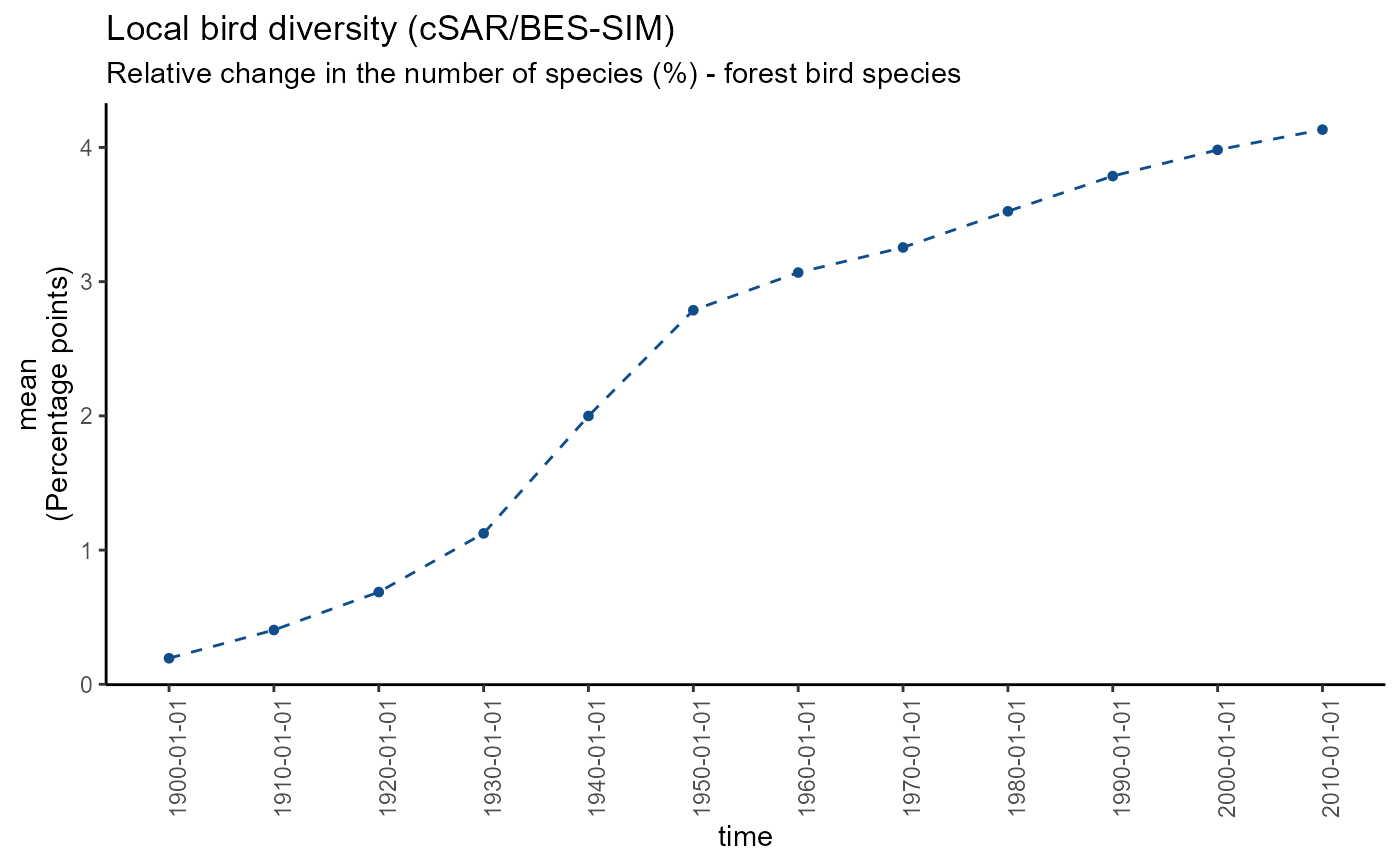 #> [1] 0.1942108 0.4044708 0.6872221 1.1244214 1.9991232 2.7869647 3.0676681
#> [8] 3.2548067 3.5242075 3.7865669 3.9818151 4.1326984
# }
#> [1] 0.1942108 0.4044708 0.6872221 1.1244214 1.9991232 2.7869647 3.0676681
#> [8] 3.2548067 3.5242075 3.7865669 3.9818151 4.1326984
# }