Map plot of the data of one timestep in one datacube of an EBV netCDF.
ebv_map(
  filepath,
  datacubepath = NULL,
  entity = NULL,
  timestep = 1,
  countries = TRUE,
  col_rev = FALSE,
  classes = 5,
  scenario = NULL,
  metric = NULL,
  all_data = FALSE,
  ignore_RAM = FALSE,
  verbose = TRUE
)
Arguments
- filepath
Character. Path to the netCDF file.
- datacubepath
Character. Optional. Default: NULL. Path to the datacube (use
ebv_datacubepaths()). Alternatively, you can use the scenario and metric argument to define which cube you want to access.- entity
Character or Integer. Default is NULL. If the structure is 3D, the entity argument is set to NULL. Else, a character string or single integer value must indicate the entity of the 4D structure of the EBV netCDFs.
- timestep
Integer or character. Select a timestep. Either provide an integer value that refers to the index of the timestep (minimum value: 1) or provide a date in ISO format, such as '2015-01-01'.
- countries
Logical. Default: TRUE. Simple country outlines will be plotted on top of the raster data. Disable by setting this option to FALSE.
- col_rev
Logical. Default: FALSE Set to TRUE if you want the color ramp to be the other way around.
- classes
Integer. Default: 5. Define the amount of classes (quantiles) for the symbology. Currently restricted to maximum 11 classes (allowed maximum for palette RdYlBu is 11).
- scenario
Character or integer. Optional. Default: NULL. Define the scenario you want to access. If the EBV netCDF has no scenarios, leave the default value (NULL). You can use an integer value defining the scenario or give the name of the scenario as a character string. To check the available scenarios and their name or number (integer), use
ebv_datacubepaths().- metric
Character or integer. Optional. Define the metric you want to access. You can use an integer value defining the metric or give the name of the scenario as a character string. To check the available metrics and their name or number (integer), use
ebv_datacubepaths().- all_data
Logical. Default: FALSE. The quantiles are based on the one timestep you chose (default). If you want include the full data of the datacube to produce several maps that are based on the same color scale, set this argument to TRUE (to allow for viusual comparison between entities or timesteps. Does not cover different datacubes.)
- ignore_RAM
Logical. Default: FALSE. Checks if there is enough space in your memory to read the data. Can be switched off (set to TRUE).
- verbose
Logical. Default: TRUE. Turn off additional prints by setting it to FALSE.
Value
Plots a map.
Examples
# \donttest{
#set path to EBV netCDF
file <- system.file(file.path("extdata","martins_comcom_subset.nc"), package="ebvcube")
#get all datacubepaths of EBV netCDF
datacubes <- ebv_datacubepaths(file, verbose=FALSE)
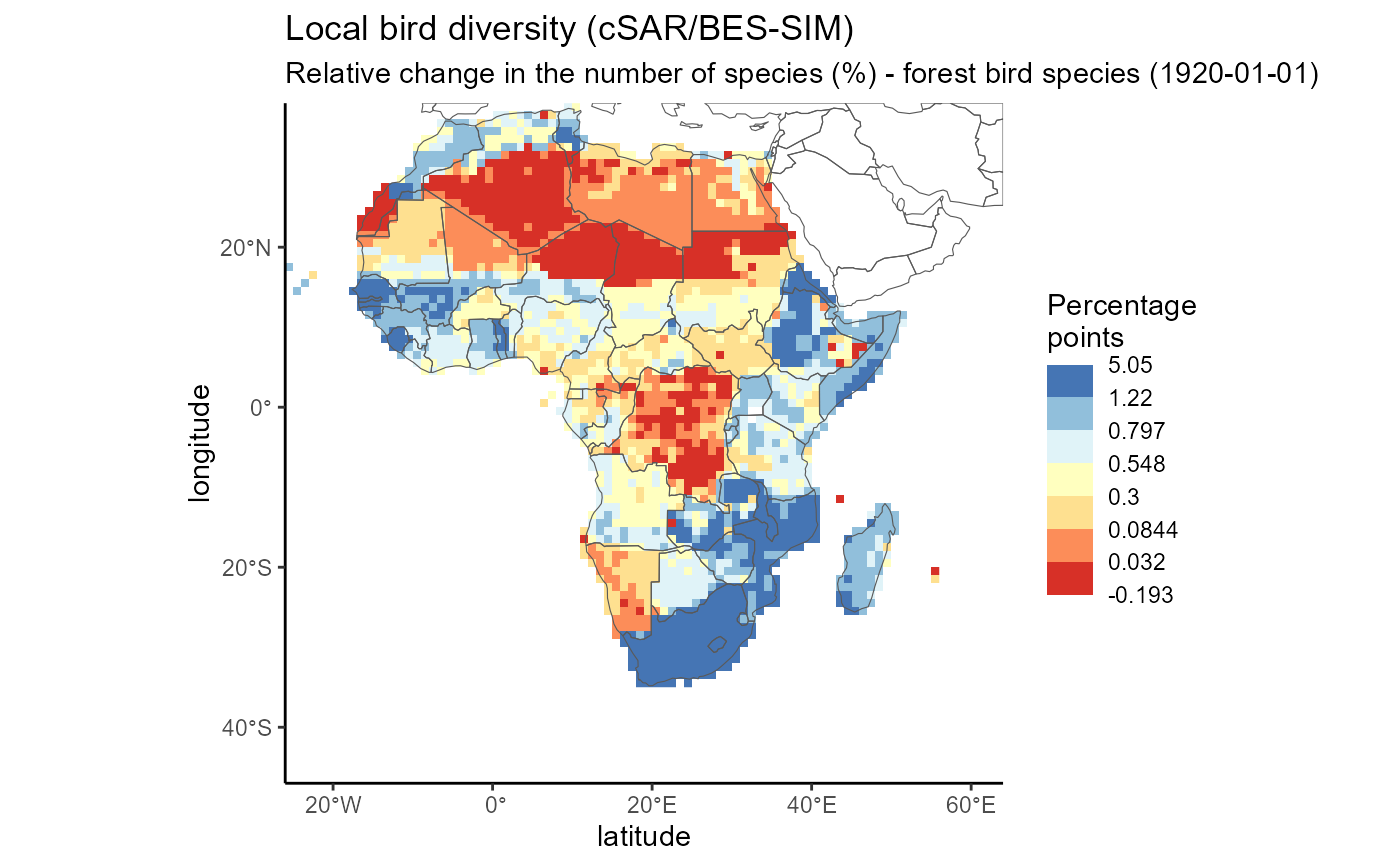
#plot a map for the 3rd timestep, divide into 7 classes
ebv_map(filepath = file, datacubepath = datacubes[1,1], entity = 1,
timestep = 3, classes = 7, verbose = FALSE)
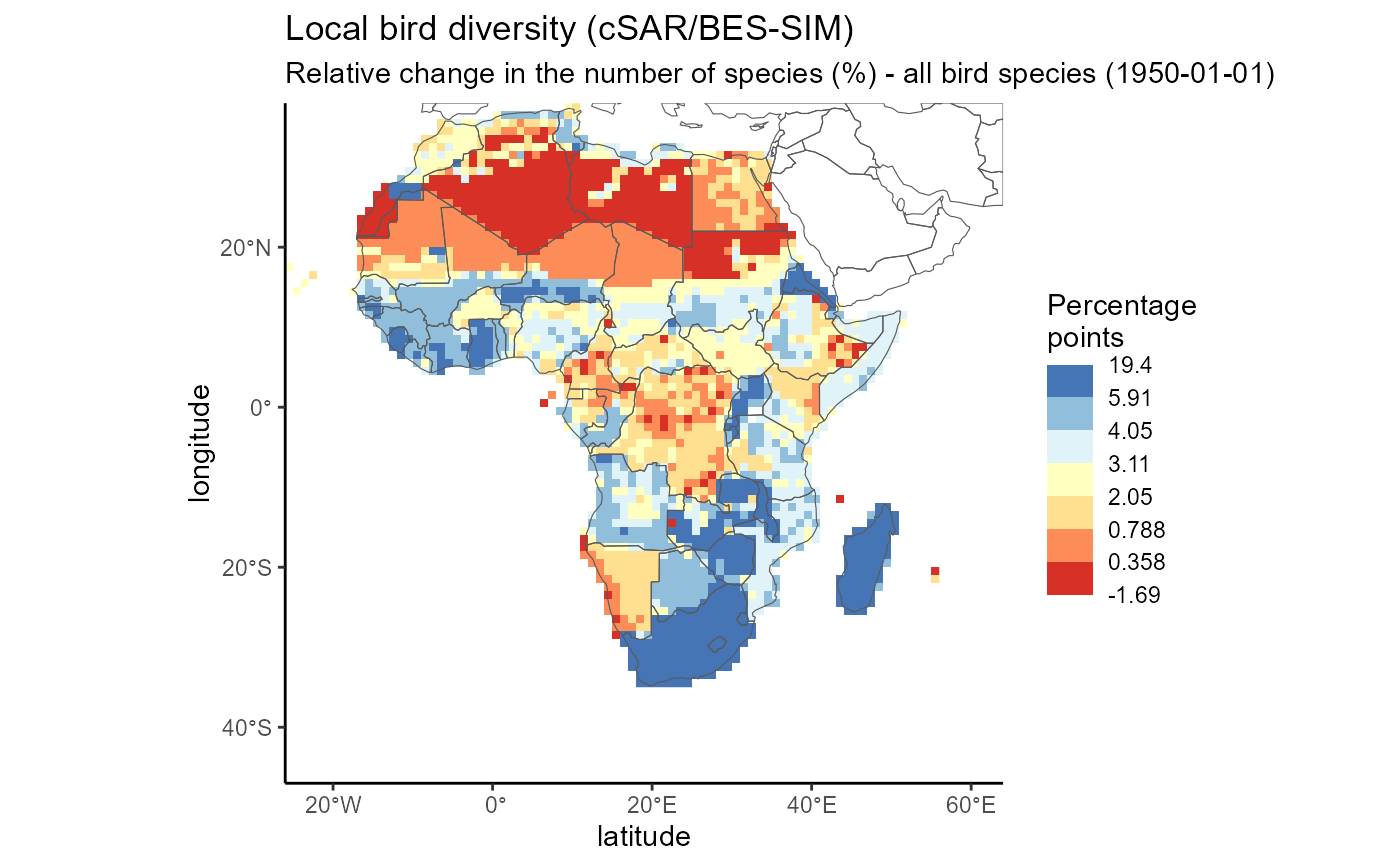
 ebv_map(filepath = file, entity = 'all bird species', timestep = "1950-01-01",
metric = 'Relative change in the number of species (%)',
classes = 7, verbose = FALSE)
ebv_map(filepath = file, entity = 'all bird species', timestep = "1950-01-01",
metric = 'Relative change in the number of species (%)',
classes = 7, verbose = FALSE)
 # }
# }